Guide
The Real Cost of Power Outages in America: Data, Trends, and What It Means for You
TL;DR
Power outages cost Americans $150 billion annually. We analyze the data on outage frequency, duration, causes, and financial impact — plus what the trends mean for backup power planning.
Americans love to think of the electrical grid as reliable. And compared to developing nations, it is. But the numbers tell a more complicated story — one of increasing outages, aging infrastructure, and a growing gap between what the grid can handle and what we’re asking it to do.
Here’s what the data says about power outages in America, what’s driving the trend, and what it means for your backup power strategy.
The Numbers: How Bad Is It?
Outage Frequency Is Rising
According to data from the Department of Energy, the Energy Information Administration (EIA), and utility reliability reports:
- Major outage events (affecting 50,000+ customers) have increased roughly 64% over the past decade
- The average US electricity customer experienced approximately 5.3 hours of interruptions in 2024, up from 3.5 hours a decade earlier
- 83% of all outage hours are caused by major events (storms, equipment failures), not routine maintenance
The trend is clear and accelerating. The grid is losing reliability at a time when our dependence on electricity has never been higher.
Regional Variation Is Massive
Power reliability varies enormously depending on where you live:
| Region | Avg Annual Outage Hours | Primary Causes |
|---|---|---|
| Southeast US | 8-15 hours | Hurricanes, thunderstorms, heat demand |
| Gulf Coast | 10-20+ hours | Hurricanes, flooding, humidity degradation |
| Northeast US | 5-10 hours | Ice storms, Nor’easters, aging infrastructure |
| Midwest US | 4-8 hours | Tornadoes, ice storms, wind |
| Texas (ERCOT) | 5-15 hours | Heat demand, storms, grid isolation |
| West Coast | 4-8 hours | Wildfires, PSPS events, earthquakes |
| Pacific Northwest | 3-6 hours | Wind storms, ice, tree falls |
| Mountain West | 2-5 hours | Lower population density, fewer storms |
For a detailed state-by-state breakdown, see our power outage statistics by state guide.
The Financial Impact
Power outages are not just inconvenient — they’re expensive:
Individual household costs per outage event:
- Spoiled food: $100-350 (average fridge contents)
- Lost wages (work-from-home): $100-300/day
- Hotel stay (if home is uninhabitable): $100-200/night
- Restaurant meals (no cooking): $40-80/day for a family
- Damaged electronics (power surge on return): $50-500
- Emergency supplies (ice, water, batteries): $30-100
- Generator fuel: $20-50/day
Total per-event cost: $150-500 for a 24-hour outage, escalating rapidly for longer events.
National economic impact:
- Estimated $150 billion annually in total economic losses from power outages (DOE estimate)
- Small businesses lose an average of $5,000-20,000 per day of outage
- Data centers and industrial facilities face losses of $100,000+ per hour
- Healthcare facilities spend $8+ billion annually on backup power systems
The Human Cost
Beyond dollars:
- An estimated 80+ deaths annually are directly attributed to power outages in the US (carbon monoxide from generators, heat-related illness, medical device failures)
- During Winter Storm Uri (February 2021), Texas experienced an estimated 246 excess deaths during and immediately after the multi-day grid failure
- 45 million Americans rely on electricity-dependent medical equipment at home (CPAP, oxygen concentrators, powered wheelchairs, insulin pumps with cooling requirements)
Why Outages Are Getting Worse: Four Converging Trends
1. Climate Change Is Intensifying Severe Weather
Weather causes approximately 67% of major outages, and weather is getting more extreme:
- Hurricane intensity is increasing — Category 4-5 storms are roughly 25% more frequent than 40 years ago
- Winter storms are becoming more erratic, with polar vortex events pushing arctic air into regions with infrastructure not designed for extreme cold
- Heat waves are lasting longer and getting hotter, pushing grid demand to breaking points
- Wildfire seasons are expanding, leading to more preemptive shutoffs (PSPS events) in Western states
The grid was designed for historical weather patterns. Current and future weather is outpacing those design assumptions.
2. The Grid Is Aging
America’s electrical infrastructure is old:
- The average age of US power transformers is over 40 years (designed for 25-40 year lifespans)
- Over 70% of transmission lines are more than 25 years old
- Annual grid investment has been roughly half of what engineering experts recommend
- Replacing and upgrading infrastructure is slow, expensive, and politically complicated
When aging equipment meets extreme weather, the result is cascading failures — one component fails, overloading the next, creating a domino effect.
3. Electricity Demand Is Growing
After decades of relatively flat growth, US electricity demand is surging:
- Electric vehicle adoption is adding significant load to residential circuits
- AI data centers are consuming enormous amounts of power (a single large data center uses as much electricity as a small city)
- Electrification of heating (heat pumps replacing gas furnaces) shifts gas demand to the electrical grid
- Remote work has increased residential daytime demand
The grid was built for a world where demand grew slowly and predictably. Current demand growth is outpacing new generation and transmission capacity.
4. Grid Modernization Is Slow
Smart grid technology, distributed generation, and energy storage could make the grid far more resilient. But deployment is slow:
- Regulatory processes can take 5-10 years for major grid upgrades
- NIMBYism blocks new transmission lines, substations, and generation facilities
- Cost allocation disputes delay interstate transmission projects
- The transition from centralized fossil fuel generation to distributed renewables creates new reliability challenges during the transition period
What This Means for Your Backup Power Strategy
The data points to a clear conclusion: grid reliability is declining, and the trend will continue for at least the next decade. This isn’t alarmist — it’s the consensus view of grid operators, energy regulators, and climate scientists.
The ROI Case for Backup Power Is Getting Stronger
If the average household experiences $500-1,000 in outage-related costs per year, a backup power investment pays for itself quickly:
A 1,000Wh power station ($500-800):
- Pays for itself after 1-2 significant outages
- Lasts 8-16 years with LiFePO4 chemistry
- Prevents food loss, enables work-from-home during outages, powers medical devices
- Our top picks: EcoFlow DELTA 3 Plus, Anker SOLIX C1000, Jackery Explorer 1000 v2
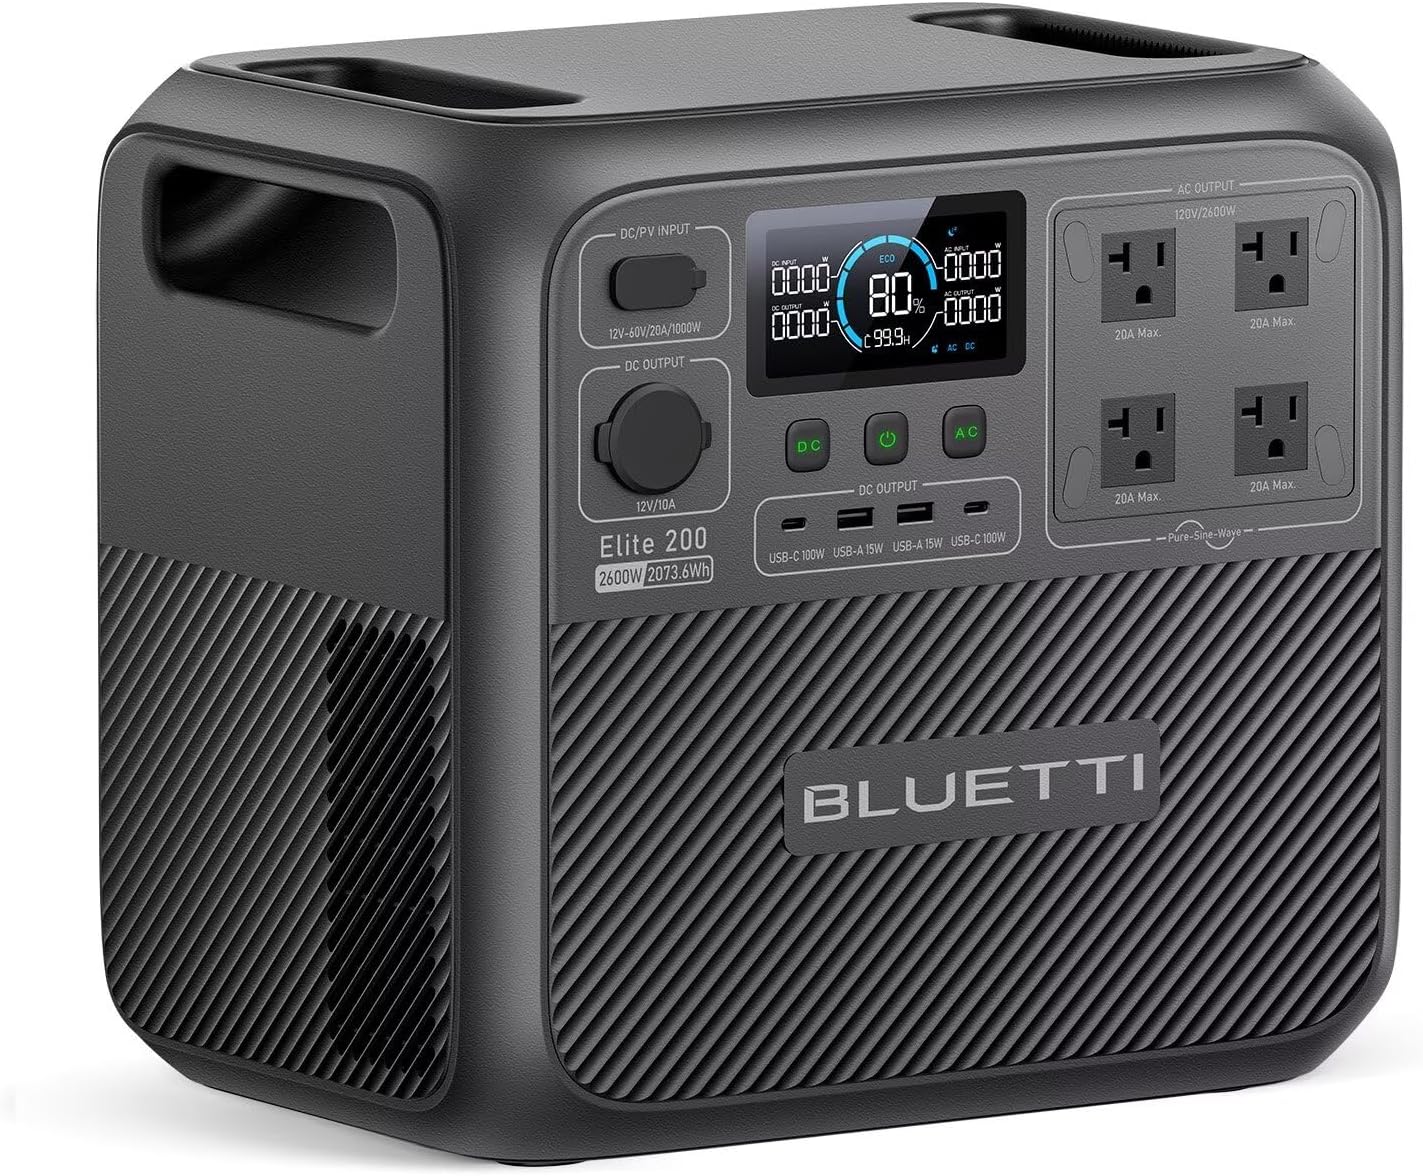
A 2,000Wh system with solar ($1,500-2,500):
- Handles 24-48 hour outages completely
- Solar panels provide indefinite replenishment during multi-day events
- Eliminates generator fuel costs and carbon monoxide risk
- Our top picks: Bluetti Elite 200 V2, EcoFlow DELTA 2 Max
A 4,000Wh+ expandable system ($2,000-5,000):
- Near whole-home backup for multi-day events
- Expandable as needs grow
- Premium investment but comprehensive protection
- Our top picks: EcoFlow DELTA Pro 3, Jackery Explorer 2000 Plus
For a detailed cost-benefit analysis, see our are portable power stations worth it guide.
Who Should Prioritize Backup Power
High priority:
- People who depend on electric medical devices
- Households in hurricane, tornado, or ice storm zones
- Remote workers who can’t afford to lose connectivity
- Families with young children or elderly members
- Homeowners with sump pumps (basement flooding risk)
- Anyone on well water (electric pump dependent)
Medium priority:
- Urban apartment dwellers (shorter outages but no generator option — power stations are ideal). See our apartment dwellers guide.
- Households with solar panels but no battery storage
- Pet owners (temperature-sensitive pets)
Lower priority (but still worth considering):
- Areas with very high grid reliability (mountain West, parts of Midwest)
- Renters with flexible living arrangements
- Households with gas heating, cooking, and hot water (less electricity-dependent)
The Bottom Line
Power outages are not getting better. The combination of aging infrastructure, intensifying weather, growing demand, and slow modernization means outage frequency and duration will likely continue increasing over the next decade. The question isn’t whether you’ll experience a significant outage — it’s when, and whether you’ll be prepared.
A portable power station with solar panels is the most practical, affordable, and versatile form of backup power for the majority of American households. It’s a one-time purchase that pays for itself quickly and lasts for years.
Browse our best power stations for home backup to find the right system for your needs, or use our emergency preparedness checklist to build a complete outage plan.
Related Reading
- Power Outage Statistics by State 2026 — detailed state-by-state data
- Are Portable Power Stations Worth It? — cost-benefit analysis
- How to Build an Emergency Power Kit — complete prep guide
- Power Outage Survival Guide — what to do when the power goes out
- Best Power Station for Home Backup — our top picks
- Power Station vs Generator — which backup is right for you
Recommended Power Stations
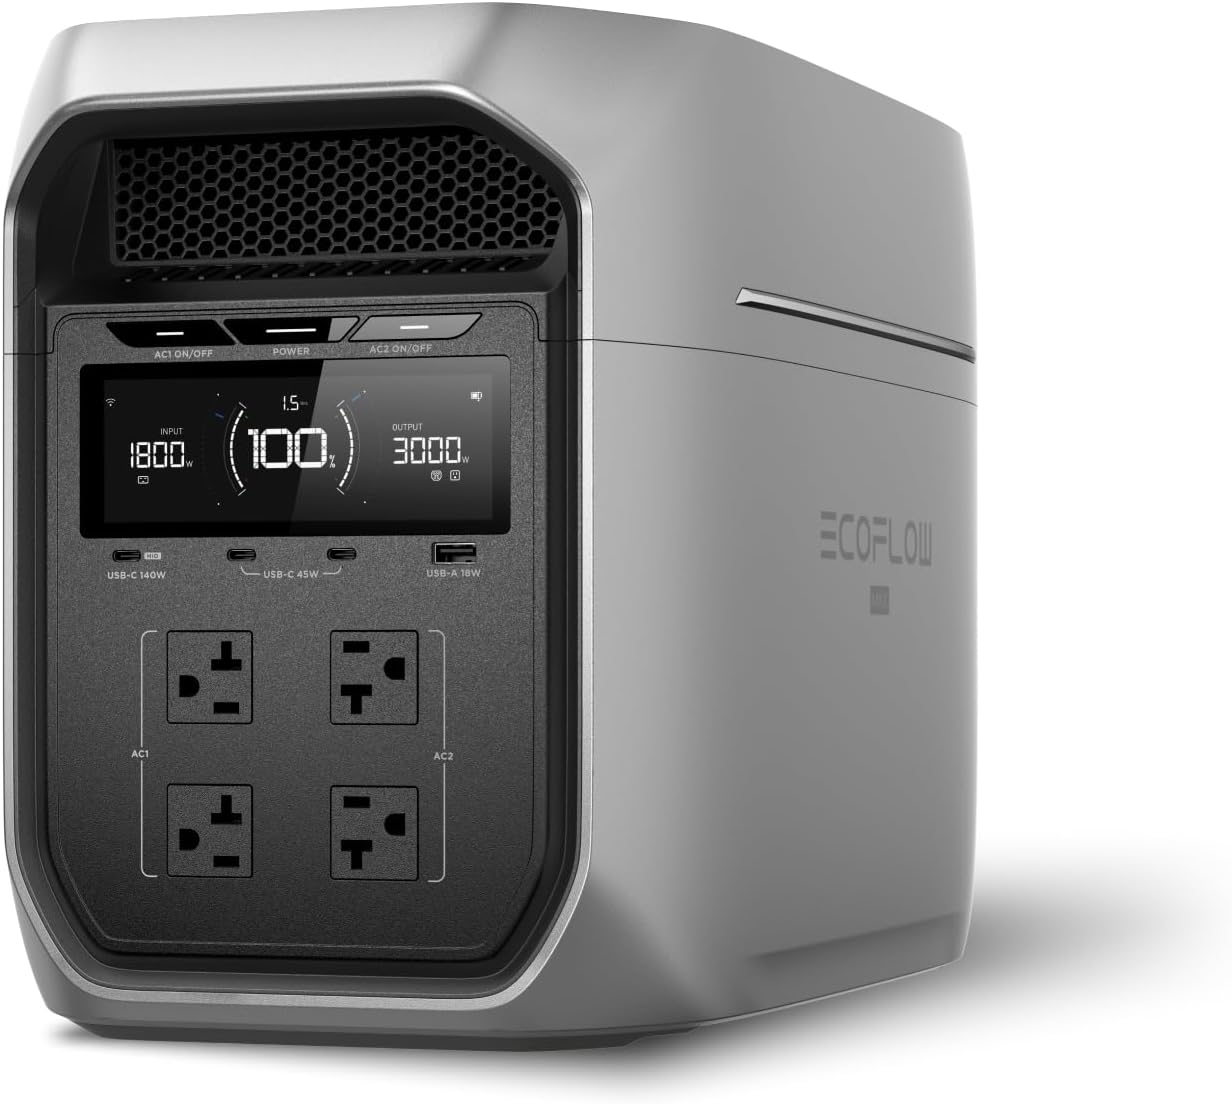
EcoFlow
EcoFlow DELTA 3 Plus
EcoFlow's newest mid-range flagship. The DELTA 3 Plus improves on the Delta 2 with faster charging, LiFePO4 chemistry, and UPS functionality — all at a lower price.
Frequently Asked Questions
How many power outages happen in the US each year?
The US experiences approximately 3,000-5,000 major outage events annually affecting hundreds of millions of customer-hours. The average American household experiences 1.5-2 outages per year lasting a total of 5-8 hours combined. However, these averages mask huge regional variation — some areas experience significantly more frequent and longer outages than others.
What is the most common cause of power outages?
Severe weather is the leading cause, responsible for approximately 67% of major outages. This includes hurricanes, ice storms, thunderstorms, and high winds. Equipment failure accounts for about 15%, vegetation (trees on lines) about 10%, and other causes (animals, vehicle accidents, cyberattacks, demand overload) make up the remaining 8%.
Are power outages getting worse?
Yes. Major outage events have increased roughly 60% over the past decade. The average duration of outages has also increased by approximately 20%. Climate scientists attribute this to more frequent and intense severe weather events, an aging electrical grid (average infrastructure age exceeding 40 years), and increasing electricity demand outpacing grid upgrades.
How much does a power outage cost the average household?
A 24-hour outage costs the average household $150-500 in direct costs (spoiled food, hotel stays, restaurant meals, lost wages). Longer outages can cost thousands when factoring in property damage from frozen pipes, basement flooding (sump pump failure), medical emergencies, and small business losses. The average annual cost of outage-related losses is approximately $500-1,000 per household.
Ready to Buy? Here's What We Recommend
Based on our testing and this guide, these are the best options for most people: